Johns Hopkins News-Letter Reports:
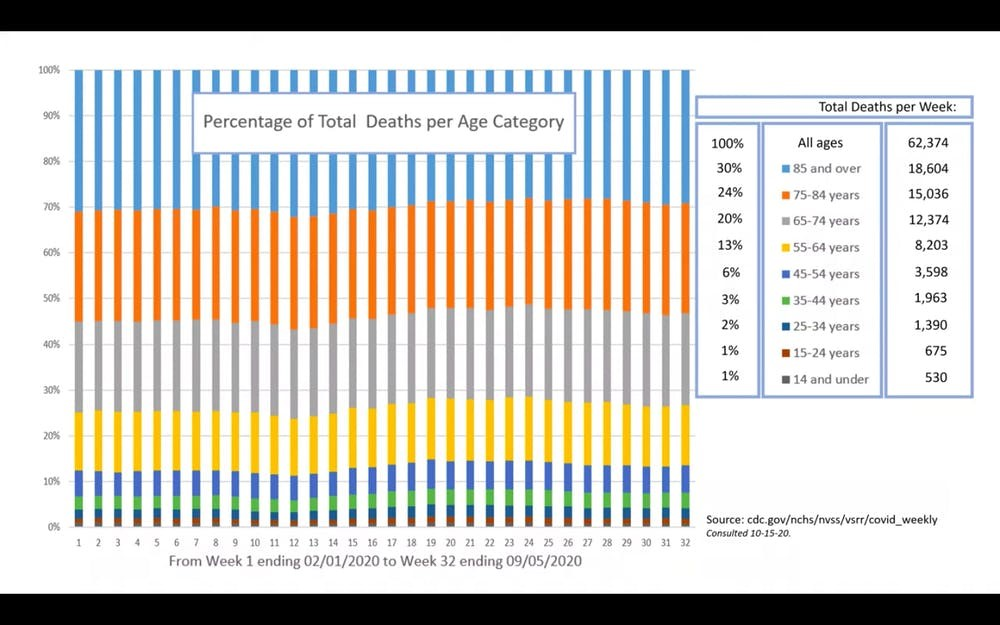
COURTESY OF GENEVIEVE BRIAND After retrieving data on the CDC website, Briand compiled a graph representing percentages of total deaths per age category from early February to early September.
According to new data, the U.S. currently ranks first in total COVID-19 cases, new cases per day and deaths. Genevieve Briand, assistant program director of the Applied Economics master’s degree program at Hopkins, critically analyzed the effect of COVID-19 on U.S. deaths using data from the Centers for Disease Control and Prevention (CDC) in her webinar titled “COVID-19 Deaths: A Look at U.S. Data.”
From mid-March to mid-September, U.S. total deaths have reached 1.7 million, of which 200,000, or 12% of total deaths, are COVID-19-related. Instead of looking directly at COVID-19 deaths, Briand focused on total deaths per age group and per cause of death in the U.S. and used this information to shed light on the effects of COVID-19.
She explained that the significance of COVID-19 on U.S. deaths can be fully understood only through comparison to the number of total deaths in the United States.
After retrieving data on the CDC website, Briand compiled a graph representing percentages of total deaths per age category from early February to early September, which includes the period from before COVID-19 was detected in the U.S. to after infection rates soared.
Surprisingly, the deaths of older people stayed the same before and after COVID-19. Since COVID-19 mainly affects the elderly, experts expected an increase in the percentage of deaths in older age groups. However, this increase is not seen from the CDC data. In fact, the percentages of deaths among all age groups remain relatively the same.
“The reason we have a higher number of reported COVID-19 deaths among older individuals than younger individuals is simply because every day in the U.S. older individuals die in higher numbers than younger individuals,” Briand said.
Briand also noted that 50,000 to 70,000 deaths are seen both before and after COVID-19, indicating that this number of deaths was normal long before COVID-19 emerged. Therefore, according to Briand, not only has COVID-19 had no effect on the percentage of deaths of older people, but it has also not increased the total number of deaths.
These data analyses suggest that in contrast to most people’s assumptions, the number of deaths by COVID-19 is not alarming. In fact, it has relatively no effect on deaths in the United States.
Consider the following figures – US Total deaths by year per CDC:
2013: 2,596,993
2014: 2,626,418
2015: 2,712,630
2016: 2,744,248
2017: 2,813,503
2018: 2,839,205
2019: 2,855,000
2020: as of 11/14 total deaths= 2,512,880
At present the US is experiencing a 1.12% increase in overall mortality rates for 2020- not good- pandemicky numbers to be sure.
However, last year, 2019, there was also a 1.12% increase. Did we miss a pandemic in 2019?
But wait it’s even “scarier”- 2018 saw a 1.22% increase in mortality rates, 2017 saw a 1.24% increase, 2016 1.27% increase, 2015 1.27% increase, 2014 1.29% increase- all exceeding 2020’s increase in mortality rate– so does this mean we have had pandemics for the last 7 years?
Does this indicate non-stop pandemics every year for the last 7 years and we just weren’t paying attention and didn’t have an ‘honest” media to keep us pinned to our beds in a proper state of fear?
And BTW 2013 all the way back to 2009 all showed .09% increases in mortality rates– don’t know where the cutoff is but certainly even these years were “pandemic like” if you feel this year was truly a pandemic.
It isn’t until we go back to the year 2008 that we see a decrease in overall mortality rates in the US. For 20 straight years there were decreases in mortality rates and then in 2009 this changed- since then we have had an increase in mortality rates. Why is that? Could this point to the 2008 economic recession as being the leading indicator rather than some supernatural viral entity?
In reality this year at present seems to be no different in overall mortality rates compared to last year and less of an increase than 5 of the 6 the preceding years. How is this possible during a “pandemic of biblical proportions?”
It’s always important to look at the rates (populations are increasing and rates vary) and overall trends to get a clear picture.
It’s also been obvious since April that how death certificates are filed have been dramatically altered (first time in history) to give liberal interpretations to “Covid” as being cause of death- and let’s not forget that PCR tests at greater than 35 cycles (as is the case in virtually every lab in the US/Europe) produce massive false positives. This article illustrates indeed that past deaths caused by heart disease are now obviously getting lumped into the catch-all “Covid” category.
Oh and BTW the WHO changed its definition of what IS a Pandemic in 2009 – might want to look into how and why that was done.
Let’s all run out and get vaccinated (with vaccine created from aborted babies)!